Estimating a progress model before the methodology has been released is always a slightly dangerous business. In this earlier blog, I included a tool which I designed to calculate the range of likely progress scores for individual children, based upon their prior attainment (Key Stage 1 average points scores) and their KS2 outcomes.
The full technical guide to this year’s KS2 accountability measures have now been released. Primary schools are currently able to access their provisional 2026 KS2 progress scores via the ‘Check Your Performance Measures Data’ service. What this is revealing is that the expectations, for most children, are even higher than the top end of the range from my earlier estimated model.
Let’s look at an example – an ‘average child’ who at KS1 achieved the Expected Standard in all areas. This gives them an APS of 8.
In the model, I had estimated that the ‘expected scaled scores’ for such a child would be within these ranges:
Reading – between 105 and 106
Writing – between 103 and 105 (i.e. highly likely to be EXS; at the higher end of the range, a 20% chance of achieving GDS)
Maths – between 105 and 106.
What we are actually seeing in this year’s model for a child with this prior attainment score, is as follows:
Reading – 107.6
Writing – 103.2 (almost all children achieving Expected Standard, a tiny minority – around 2% - awarded GDS
Maths – 106.8
We can see that in both reading and maths, that expected outcome is higher than the top end of the range I had given in my earlier model – 1.6 scaled scores higher in the case of reading.
Why is this? Well this tells us that national rates of progress between KS1 and KS2 have increased quite a bit since the last year when we had progress data (which was 2023). This is perhaps not surprising. After all, the children who completed KS2 in 2023 would have been disrupted by the Covid lockdowns during their Years 3 and 4 and this is quite likely to have affected their progress rate. For the children who completed KS2 last summer, Covid interrupted their learning when they were in Reception and Year 1. This may have led to lower than usual KS1 outcomes, but progress from KS1 to KS2 may actually have been stronger than what we typically see, as children caught up on lost learning and knowledge gaps were filled.
Just to further explain the implications of the above – we are talking here about an example child who was at the Expected Standard across the board at KS1. If they finished KS2 with scaled scores in reading and maths of exactly 100 (i.e. at the threshold of the ‘expected standard’) their progress scores would be -7.6 and -6.7 in reading and maths respectively: significantly below average progress.
Let’s look at some other example children and compare what the actual 2026 model appears to be showing with the estimates I previously produced:
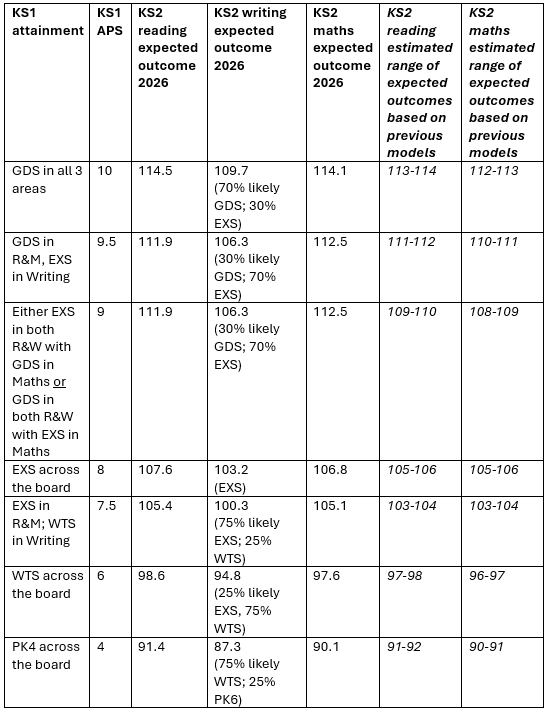
As you can see, in almost all the cases illustrated above, the actual expected scores in the 2026 model are higher than the top end of the range of my earlier estimates – mostly within or around 1 scaled score difference, but in some unusual cases (e.g. prior attainment of 9 points) over 3 scaled scores higher! What seems surprising is that in this year’s model, prior attainment scores of 9 and 9.5 both fall within the same prior attainment group, meaning that the ‘expected outcome’ is the same for both of these prior attainment scores. This was not the case in previous progress models.
At the lower end of prior attainment, such as children working at PK4 in KS1, the estimates were much closer – telling us that the national pattern of progress across KS2 for children at this end of the attainment spectrum has not changed much between 2023 and 2026.
Whilst we are on the topic of the data included in CYPMD, it has emerged that the DFE have made an error in assigning learners to prior attainment groups – specifically that children with a KS1 APS of 8 points have been mis-categorised as high prior attainers. Any score above 8 would make someone a high prior attainer, but a score of exactly 8 should be allocated to the Middle prior attainment group. NB this does not in any way affect the calculation of progress scores for individual children, it just affects the way the data is reported against prior attainment groups. The DfE have confirmed that they will rectify the mistake in the published dataset that is due to be released in December.
Thinking ahead to 2027, it is worth remembering that we can never accurately predict the national progress model ahead of its publication, but it could be reasonable to assume that next year’s model will be broadly similar to this year’s, given that there is not such an obviously marked difference between these two cohorts in terms of their experience of a global pandemic.
Headteachers in Hertfordshire schools, please note: there may be minor differences between the progress figures you see in the CYPMD site and those that we have provisionally released on the Herts Assessment Profile. The latter will be updated in due course to reflect final figures.
Headteachers across England can continue to access their provisional data in the Check Your Performance Measures Data site until 5pm on Friday 18th September. The figures will be published in the IDSR and in Compare School Performance later this year.
Ben Fuller