KS2 progress scores will be returning for the current Y6 cohort. But can we predict what targets children need to hit in order to attain positive progress scores?
The short answer to the above question is no, we can’t say for sure what these target attainment scores will be.
The reason for this is that the progress model changes every year, based on what has happened nationally. A positive progress score is achieved when your pupils have attained a higher scaled score than the national average scaled score for children with the same starting point (i.e. KS1 average attainment) – as I explained in this previous blog. It is always the case that we can’t say for sure what the national pattern of average progress will be in any given year. But it’s even more complicated than normal this year.
We last had KS2 progress scores in summer 2023, so we know what the national rates of progress looked like then. We could, therefore, use these as a guide to what children should be attaining next summer. However, there are very good reasons to hypothesise that the national pattern of progress might look like different in 2026. The children who completed KS2 in 2023 had endured national lockdowns and a sudden switch to online lessons for significant chunks of 2020 and 2021 (i.e. during their Years 3 and 4). This is likely to have negatively affected progress rates across the whole country. For the current Year 6 cohort, their KS2 has not been interrupted in this way - therefore we might expect the national average progress rates to be higher in 2026 than they were in 2023.
On the other hand, for this Y6 cohort, the effect of the pandemic hit them particularly hard in their Reception and Year 1, both extremely important formative years. They might, therefore, have under-achieved (compared to what we might normally expect) when they completed KS1 in 2022 – and might have had major gaps in their learning. How that has affected their progress across KS2 is impossible to predict – for some children in some schools, they might have caught up on lost learning very effectively. Progress in these cases will be strong. For other children, particularly those experiencing multiple barriers such as socio-economic disadvantage, SEND etc, it could have been a real challenge to catch up on lost learning.
In short, it is impossible to predict what the national average outcomes for each prior attainment group will look like.
A better proxy for what progress might look like this year might be to go back to the 2019 model, before Covid. Unfortunately, this model is not comparable because of differences in the way KS1 was assessed. For children who completed KS2 in 2019 – and hence completed KS1 in 2015 – their KS1 assessment was reported using the old ‘levels’ system. We can’t really draw equivalences between the different ways of assessing KS1. (Believe me, I have made some attempts to statistically align the different models and ended up concluding that it was a futile exercise.)
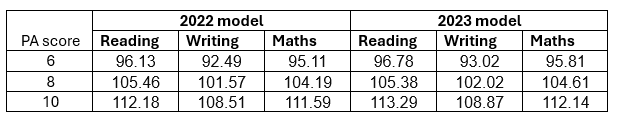
Our best bet, then, if we want to try to establish some ‘target scaled scores’ that we would hope will yield positive progress measures, is to look across both the 2022 and 2023 models and use these to set a ‘minimum expectation’ – with the understanding that the 2026 model could end up being a point or so higher.
The table below illustrates 3 example children – the first assessed at Working Towards in all 3 subject areas at KS1 (prior attainment score of 6); the second assessed at EXS across the board (score of 8); the third assessed at GDS across the board (score of 10).
Using the above, I might be inclined to set the following ‘minimum targets’ for each prior attainment group shown above:
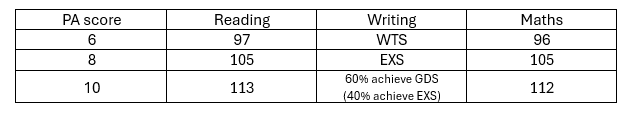
The above scores might give us a safe indication of where ‘average progress’ will fall, but to be on the safe side we might want to add an extra scaled score point on to the above.
A word about the writing target. Due to the way the model is calculated (which I discussed in this blog) we end up with national average writing scores that are not actually attainable by any individual child. For example, in 2023, the national average writing score for children with a prior attainment of 10 was close to 109. Given that an outcome of EXS is scored as 103 and GDS is scored as 113, no child can end up with a score of 109. But, roughly speaking, if around 3/5 of the children in this group achieved GDS and the other 2/5 achieved EXS, we would end up with this average score. From the point of view of target-setting, then, if you happened to have 5 children all with this prior attainment score, then statistically you might expect 3 of them to achieve GDS and the other 2 to achieve EXS. If this does indeed happen, your average progress for this group would be at least average (provided the national average progress rates don’t significantly change).
In the downloadable spreadsheet below, I have produced what we might consider to be realistic minimum targets for every prior attainment score. It will even calculate them for you, if you enter the children’s KS1 assessment data. However – important disclaimer – there is no guarantee that, by attaining these targets, children will achieve positive progress scores, for the reasons explained above. This tool is intended to be used as a guide only. As stated earlier, for a safer bet, aim 1 scaled score higher (or more).
We won’t know the actual 2026 progress model until after the children have taken the tests and the data has all been processed. The good news, though, is that once we do have the model, we might expect it to be a reasonably good basis for predicting the 2027 model, as the experience of these two cohorts of children nationally should have been broadly very similar.
Of course, it all changes again in 2028, when the Y6 children’s progress will be measured from their Reception Baseline Assessment scores. Quite what that national model will look like is anybody’s guess.
Ben Fuller