A powerful resource for primary English and maths leads, available for free to all schools, is the Question Level Analysis (QLA) element of the DfE’s Analyse School Performance (ASP) site. In this blog I will highlight some of the lines of enquiry subject leaders might follow.
Of course, an important principle of all assessment activity (indeed, of any activity) is that we should only spend time doing things that are worthwhile – i.e. things that tell us something useful (that we didn’t already know) and that could inform our future decision-making or lead to some new actions. When we look at QLA data, we must bear in mind that we are looking at information that relates to last year’s Year 6 cohort, who will in most cases have now left the school. Finding out where that cohort performed strongly and where they ‘went wrong’ is not necessarily going to be completely applicable to your current cohorts, but it could be extremely powerful if it reveals something systemic about your school – maybe about your curriculum, your pedagogy or your preparation for that peculiar week in a child’s life that we call SATs.
Accessing the QLA
Before I dive into what me might discover from QLA, a quick word about how to access it.
Every headteacher should be be able to access the ASP site via DfE Sign-in. Every school should also have a user-approver for DfE Sign-in, who is able to create logins for other members of staff and allocate them the services that they need. This user-approver might be the headteacher or might be a member of the office team. Good practice would be for this person to create individual logins for all senior leaders in the school and, I would suggest, the curriculum leads for English and maths. Provided a user has been granted access to the ASP (Named) service, they should be able to access QLA. If you log into ASP and can’t see the link to QLA, you have not been given the right level of permissions, so speak to your user-approver. You might have been given access to ASP (Anon) – which does not allow access to pupil-level data.
Once you are logged in and looking at the QLA element of ASP, you will find the data for your school, compared with national, showing performance in last summer’s tests at overall level, broken down by domain (sub-topic within the subject area) or by question.
Exploring maths QLA
The first thing we see is the bar chart, showing the percentage of correct responses across the school, with a national comparison, for each domain (pictured below). When hovering over each bar, the number of marks available for each domain along with the school and national correct response rates are revealed.
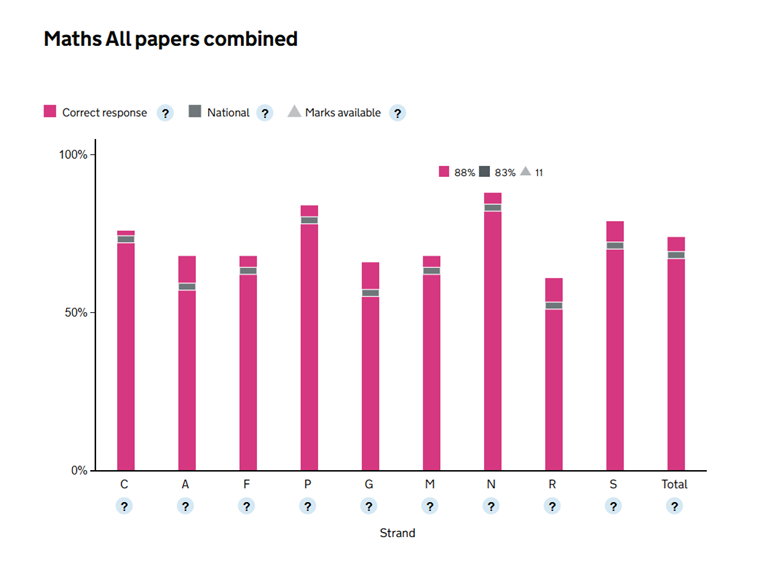
For convenience, here is a summary of the data for the 9 domains:
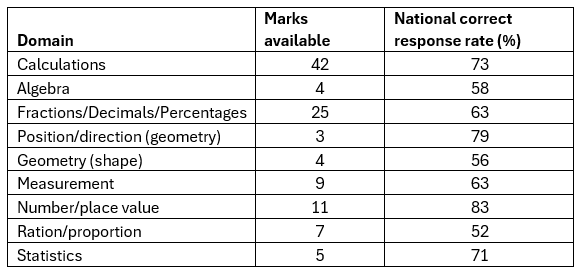
It should be noted that the largest number of marks available is for the Calculations domain (hardly surprising really). Nationally, 73% of the possible marks for this domain were awarded. It is also worth noting, by the way, that a very significant proportion of those marks can be gained from questions that test elements taught in Years 3, 4 or 5 of the National Curriculum. The published mark scheme indicates, for each question, which element of the curriculum, and the year group in which it should be taught, is being tested.
The second largest number of marks available is for Fractions/Decimals/Percentages, although nationally only 63% of marks were awarded in this domain. The domain with the highest proportion of correctly answered question is Number/place value at 83%.
The biggest ‘wins’, therefore (from the point of view of attainment in the SATs which, I accept, is not the be-all and end-all of primary school life) are to be made by focusing a large part of your teaching on these areas – including building children’s knowledge, fluency and strategies for reasoning.
If the QLA figures for your school differ significantly to the national figures for these domains, ask yourself why that might be. Could it be to do with how much curriculum time was devoted to these areas? Is it to do with pedagogical approaches? Are strong foundations being laid in lower Key Stage 2 (and earlier) that are being successfully built upon in upper KS2? Are your children stronger at the non-contextualised questions (arithmetic paper) than the reasoning questions and, if so, why might that be?
It is then worth drilling down to look at the question-level data. Are there particular questions where your children’s correct response rate differs significantly from national? If there is a question where your children did not on the whole perform well, what is it about that question? Were they just not familiar enough with the mathematical content of that question, or is it content that you know they understand, but that has been presented in a way that is unfamiliar to your children? Maybe the wording of the question caught out some of your learners. Perhaps it is an area that has not had so great a share of curriculum time in your school. Perhaps it relates to knowledge taught in earlier year groups, which pupils have not had opportunities to retrieve and practise for some time.
When looking at the data for individual questions, the proportion of children who attempted the question can also be illuminating. Looking at the figures for question attempt rate, across the two reasoning papers, the question that fewest children attempted is the final question on Paper 2 – only 87% attempted to answer. (Of course, this may be in part due to the very fact that it is the final question, hence some children might not have reached it if they ran out of time.) Let’s look at the question.
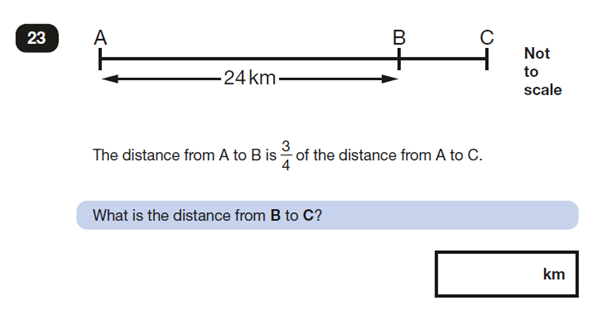
The question is classified as a ratio/proportion question - although neither of those words are used in the question. Whilst it may appear daunting to some, it’s the kind of question that lends itself very well to a bar modelling approach for solving it – and is actually quite straightforward. (To see how a bar modelling method could have been used to approach this particular question, along with a few other examples, see this recent blog from the HFL primary maths team).
It may surprise you to learn that only 36% of pupils nationally answered this question correctly. It could be interesting for schools to explore how their own children’s proportion of correct responses compares to that figure. If the school figure is significantly higher, that could be excellent evidence that the school’s current approach to teaching children how to solve numerical reasoning problems is effective. You can also compare your pupils’ attempt rate with the national. If there has been a strong teaching focus on solving reasoning problems, it would certainly be heartening to see a greater proportion than the national figure of 87% at least having a go at answering this particular problem, even if some don’t ultimately arrive at the correct answer.
Exploring spelling
The QLA data for spelling might also be an interesting area to explore. The table below shows the 20 words from the 2025 spelling test and their national correct response rate.
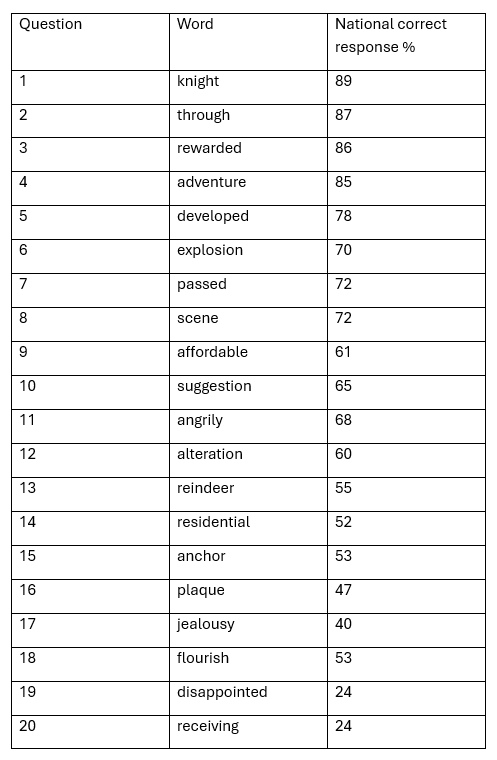
There are a few interesting things to note about the spelling test in general. It can be seen from the above list (and this has been true for every single previous KS2 spelling test – see this blog from last year) that:
- Quite a few words on this list involve the adding of a suffix or a prefix (or sometimes both) to a root word, e.g. rewarded, explosion, affordable, angrily, disappointed etc
- There are a few homophones in the list (knight, passed, scene)
We can confidently predict that these sorts of words will come up each year in the spelling test, based on previous tests and on the fact that both these elements are made explicitly clear in the national curriculum for spelling. It may seem surprising, therefore, that only 24% of children nationally correctly spelled ‘disappointed’, a spelling that can easily be derived using a good knowledge of prefixes and suffixes. What the data doesn’t tell us is the nature of the incorrect answers. Maybe they are caught out by the double ‘p’, or perhaps they have incorrectly written a double ‘s’. We can’t be sure. What we can say is that if the proportion of your children correctly spelling ‘disappointed’ is significantly higher than 24%, this would indicate a strong performance in the teaching and application of morphology in spelling.
Again, it may be of limited value to over-analyse the reasons why particular children didn’t score too well in the spelling test, given that those children have now all moved on from primary settings. However, if this QLA data reveals any interesting trends or patterns, such as consistently below average success in spelling words comprised of a root plus a suffix, this could indicate something systemic (such as the amount of curriculum time devoted to teaching this) that would be worthy of further investigation and action.
Similarly, the data might illuminate for a school where they are being particularly successful – and this is also worth unpicking, to understand the underlying causes of this success and potentially apply these elsewhere.
Exploring reading
There is of course also QLA data for the reading test paper. Opinions may vary here, but I find this element slightly less useful than those explored above. The reason for this is that the vast majority of marks on the paper are awarded for these 2 domains:
- Retrieve and record information or identify key details from fiction and non-fiction (typically about 30% of the marks)
- Make inferences from the text or explain and justify inferences with evidence from the text (typically about 50% of the marks)
The chances are, the QLA data will reveal a need to improve children’s performance on inference. However this is not entirely helpful, because the skill of ‘inference’ actually depends upon lots of inter-related skills, including a strong vocabulary knowledge and the stamina and fluency to be able to access the reading texts in the first place. More on this in this blog from our HFL primary English team.
To conclude, as I always say, data raises questions – it doesn’t necessarily give us the answers. But this QLA is powerful data and the questions it raises could lead to some pertinent lines of enquiry which could ultimately lead to curriculum development, more focused teaching and improved outcomes for children.
If your school curriculum for maths or spelling is in need of an overhaul, take a look at our Essential Maths and Essential Spelling resources.
Ben Fuller