I don’t know about anyone else, but I do love a good look at the end of KS2 assessment Question Level Analysis (QLA) when it is published on the DfE’s Analyse School Performance (ASP) site. It interests me to dig into questions where pupils have scored well nationally, but more so, where pupils have been less successful. As a former maths subject leader and Year 6 teacher, I found this a useful tool and point of reflection. Even though the data relates to children who have moved into KS3 by this point, the QLA can provide a powerful lens to consider implications for supporting teaching and strengthening fluency across school for the current cohorts we have.
In Ben Fuller’s blog Using Question Level Analysis to inform your curriculum evaluation, Ben goes into more detail about what the QLA is, how to access it, and lines of enquiry that might be useful for both maths and English. It is well worth a read.
The focus of this blog is digging into the QLA data from the 2025 arithmetic paper and considering the implications. The aim with the timing is to support our current cohort of Year 6 children to secure learning over the coming term, based on knowledge of the challenges faced by previous cohorts.
So, how did children get on in 2025 with the KS2 arithmetic paper in maths? Let’s begin with who attempted the questions and the overall success rate:
Perhaps unsurprisingly (as the arithmetic paper tends to build in complexity) the average success rate for the first 10 questions in the paper was 90%* with an average of 99%* of children attempting them. Even for the first 15 questions of the paper, the average of correct answers remains high at 89%* with 99%* still attempting.
And again, unsurprisingly, if we look at the other end of the paper, questions 27 to 36, we see a drop in the average success rate to 57%* with the average number of children attempting to answers these questions also dropping a little, to 86%*. Although we see a more significant drop in the accuracy rate, I do think that it is encouraging that a good proportion of children are getting to the end of this 30-minute, 36 question paper.
To me, this suggests that the majority of children manage to maintain stamina. However, within your current cohort of Year 6 pupils, this might still be worth reflecting on: Do all the children manage to maintain focus and keep their stamina up over the 30 minutes? This takes effort and resilience to do. And, what is their accuracy like toward the end of the paper? If it dips, looking at the individuals, is this more about the challenge of the calculations required or test fatigue?
We know that the KS2 SATs are designed to test learning from across Key Stage 2. Knowing that the arithmetic paper focuses on number, including place value and calculation, plus fractions decimals and percentages, there is some level of predictability to the questions. The Primary Maths Team at HFL Education have been able to summarise this. The document groups questions by their focus and allows us to explore them by area of focus.
Analysing the arithmetic papers initially in this way then allows us to build in rehearsal with current Year 6 in a more strategic way. Based on these question types and groups, what do your pupils need more rehearsal of?
Both of the above points – the stamina required and the broad groups of questions that have previously come up, we can design some rehearsal opportunities that target these and make the most efficient use of the time available.
Going deeper, we then need to look at the challenge that some specific questions posed – what made them tricky and how can we use this to ensure we design precise teaching and rehearsal that targets this understanding.
So, let’s now pick some high value areas of the paper to delve into – fractions and percentages and what this might mean for teaching and learning. Of the 2025 arithmetic paper, 40%* of the total marks come under the domain of FDP (fractions, decimals and percentages). Last summer, across the 16 questions, children scored on average 79%* with 91%* of pupils attempting them. This ranged from question 11, with great 85%* success rate to question 33, which had a much lower success rate of 43%* (the lowest of all questions in this paper).
A spotlight on percentages
Each year, we’ve come to expect a couple of questions in the arithmetic paper which assess children’s understanding of calculating with percentages – in 2023 there were 4 questions, in 2024 there were 2 and in 2025 there were 3.
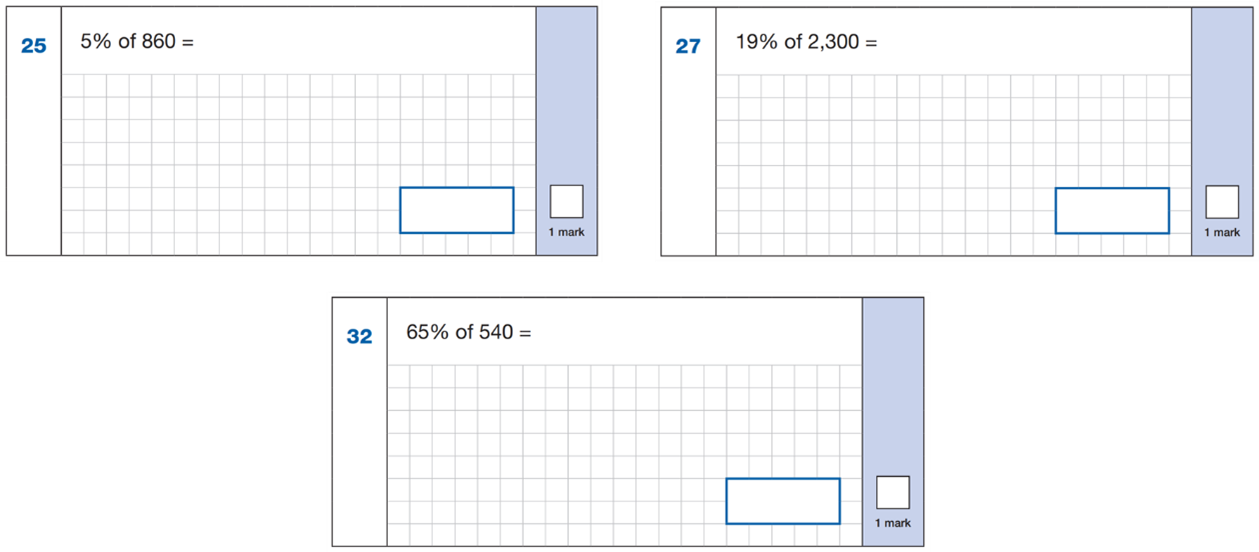
The national average for success across all 3 questions was 64%*. For question 25 this was 74%* (93%* attempting), for question 27 this was 61%* (89%* attempting) and for question 32 this was 57%* (84%* attempting). These numbers possibly indicate that for some children, stamina may have played a part, as the attempt rate drops as we move towards the end of the paper.
It might be worth considering how the majority of your Year 6 children last year might have gone about tackling these. For question 25; finding 5% of 860, would they have made the link between finding 10% and then halving this to find 5%? Or, would they divide by 100 to find 1% and then multiply up? Of course, the second strategy would work for any percentage question however there is much more room for error and more demand on stamina at a point in the paper when reserves might have been dwindling.
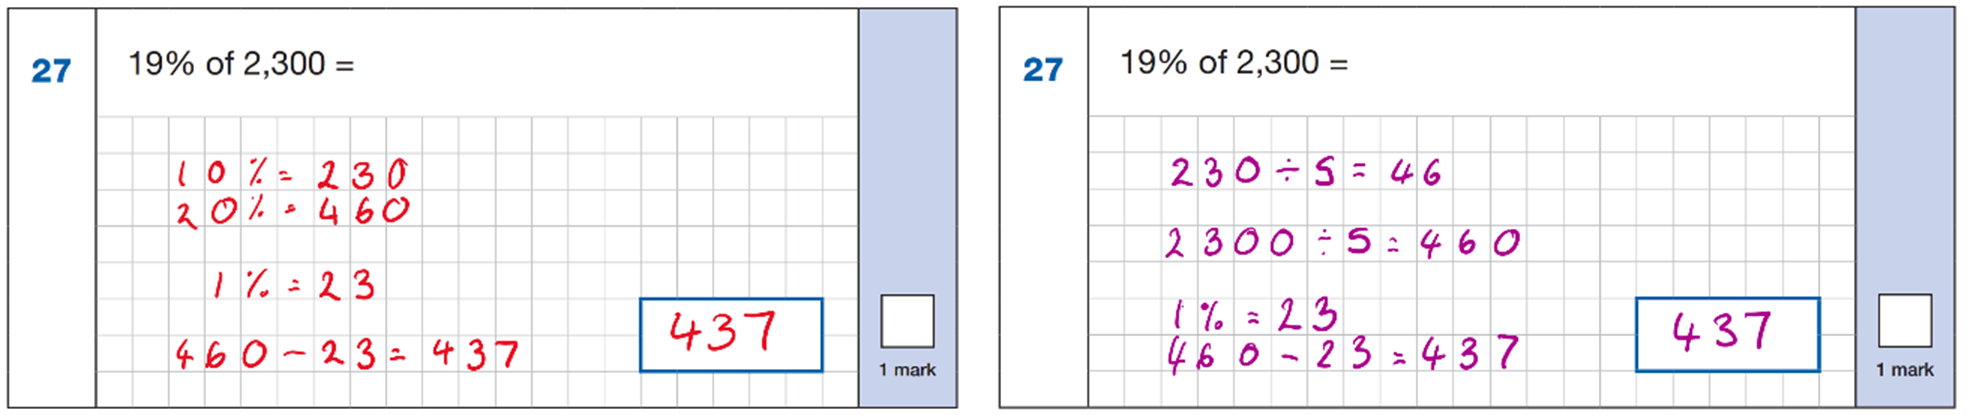
I wonder, when finding 19% of a number, how many children would consider the closeness of 19 to 20. And then what strategies would they use to find 20% before then taking away 1%? Would they find 10% and double? Or would they have used ÷5 to find , understanding that this is the same as finding 20%? Again, if children used a strategy of finding 1% and multiplying by 19, or, finding 10%, then 1% x9 and adding these together, are errors going to be more likely?
And what about question 32? The least successfully answered question of the set of percentage of amounts? How would you find 65% of 540? Below is my offering!
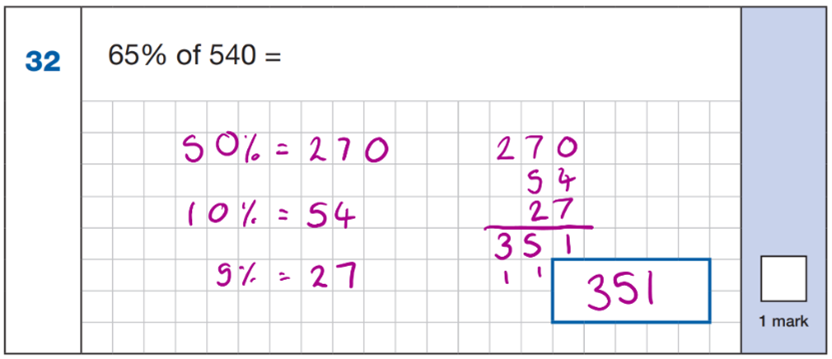
A reflection point: Are our Year 6 children really confident with flexible regrouping and do they see the usefulness of this when calculating with percentages? If, for example, we regroup 65% into 50%, 10% and 5%, I would argue that this is a fairly simple question to solve!
Would it be useful to build opportunities into our planned rehearsal for children to regroup percentages into manageable parts and use known facts. If 1%, 10%, 50%, 5% and 20% are easier to find, can we use and combine these to find other percentages, such as 49% or 61%.
A spotlight on fractions
Here are 2 of the questions which came up in 2025:
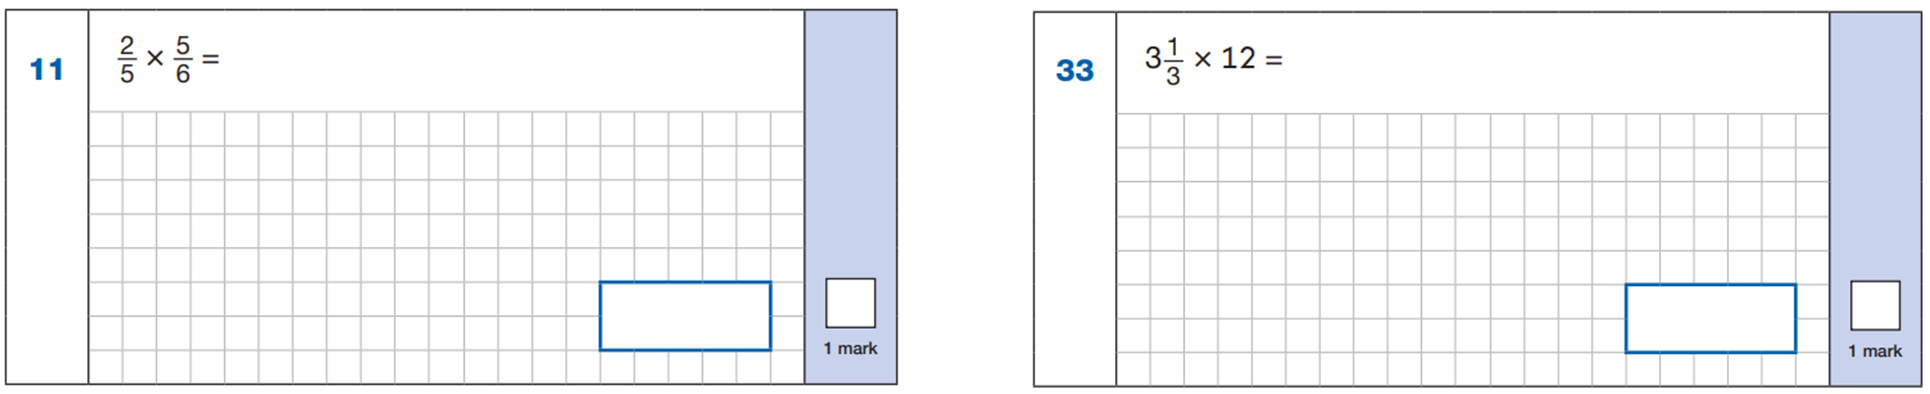
A reminder from earlier in the blog that for question 11, there was an 85%* success rate, but for question 33, there was just a 43%* success rate (the lowest of all questions in this paper).
Before we celebrate the success of question 11 however, it might be worth considering why nationally, 15%* of children did not get this question correct. This is tricky to do without seeing the exact answers of course. This question is fairly early on in the paper and if children remember the generalisation that we can ‘multiply the top, multiply the bottom’ then they’ll find these are ‘friendly’ numbers to multiply; 2x5 and 5x6.
But what if they forget this process? If we have taught multiplying pairs of fractions using a process alone (without any concrete or pictorial representations), then the children who forget the process might not have a visual that they can fall back on. However, if we have spent time exploring how to find a fraction of another fraction, two fifths of five sixths in this example, and link this to previous learning with arrays and multiplication, plus visual representations and use this alongside the process, we are likely to create a stronger understanding and connection to the learning. This might support children who may forget a numerical process on its own.
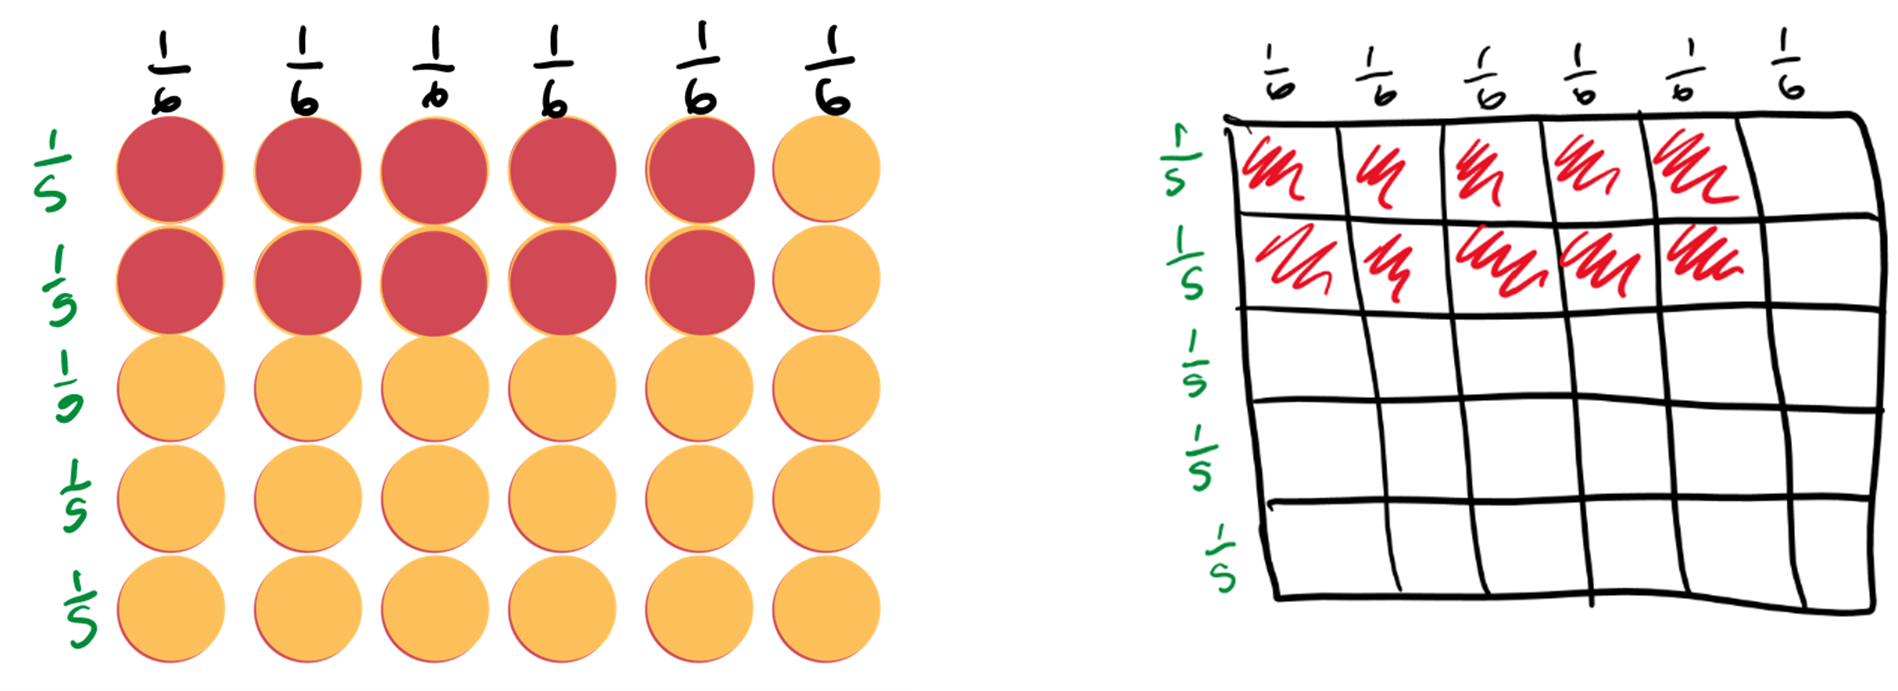
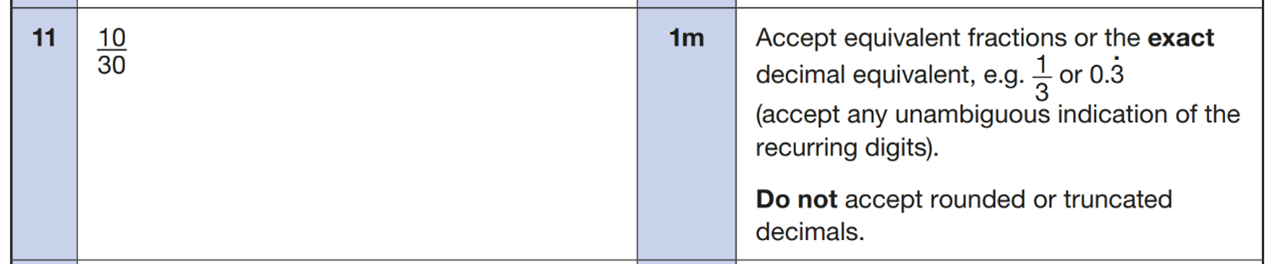
Both of these representations show how sixths and fifths can be represented in an array and how 2/5 of 5/6 is 10/30, and so also 2/5 x 5/6 = 10/30. For this question, children could have simplified the answer to 1/3, however they don’t need to do this to get the mark; 10/30 would be acceptable. Do see the screen shot below from the 2025 Key Stage 2 mathematics test mark schemes Paper 1 for clarity:
Now let’s turn our attention to question 33. This question had an average success rate of just 43%* with 83%* of children attempting it. So, what made this question much trickier? I wonder how many children did the following:
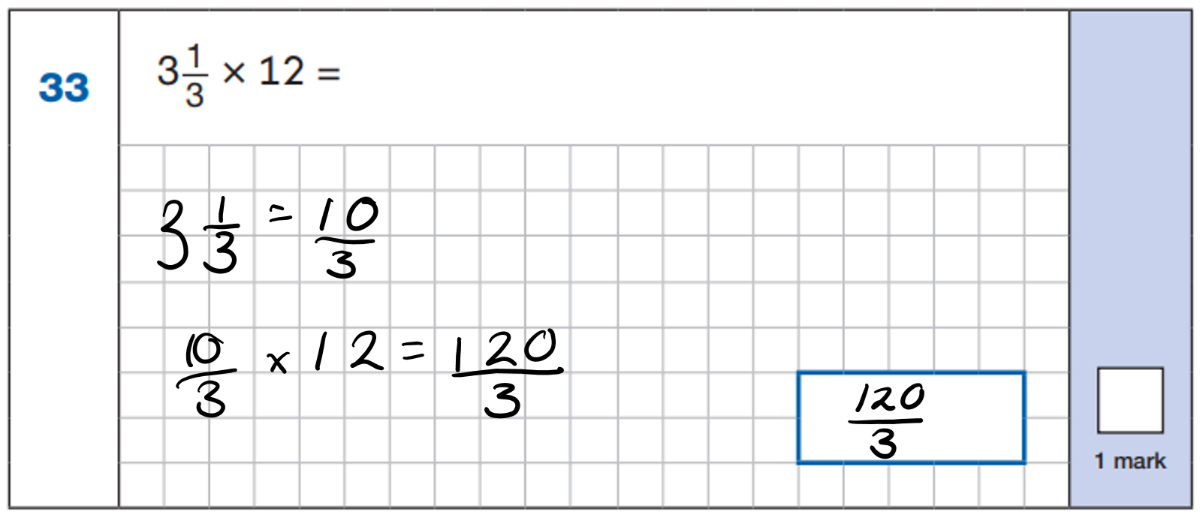
The mark scheme is quite clear that this answer unfortunately cannot be accepted:

However, even to arrive at the answer 120/3 there is lots that the pupil would need to have understood:
- the conversion is correct; 3 1/3converts to 10/3
- the multiplication is correct; 10/3 x 12 = 120/3
- the understanding that the denominator remains 3 (we are still working with thirds) is also correct.
But, we know that 120/3 does not achieve a mark.
So, for the children that did reach this point of 120/3, we can only guess that a number of the children either did not then convert 120/3 to 40, or that in attempting to make the conversion they made an error.
So, why is 120/3 not acceptable? Below is a screenshot from page 7 of the 2025 Key Stage 2 mathematics test mark schemes Paper 1 which explains using the example of 80/4, showing that this would not be awarded a mark. This is because 80/4 results in an integer answer because 80 ÷ 4 = 20.
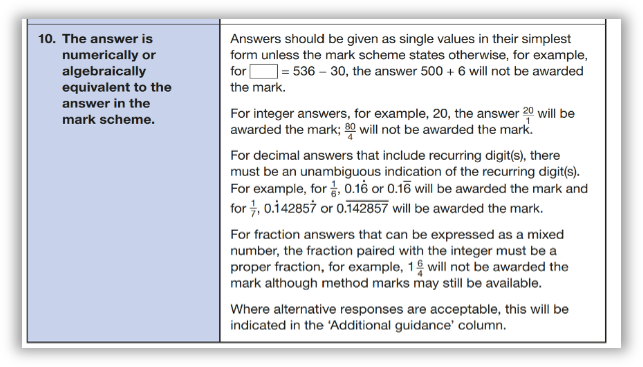
Children need to be able to notice when an improper fraction will convert to a whole number - my hunch would be that this is where a lot of children made errors. Is this a small point that your pupils would benefit from some practice with: identifying improper fractions that convert to whole numbers.
Is there an easier way to tackle this question? I wonder what you think of the following strategy:
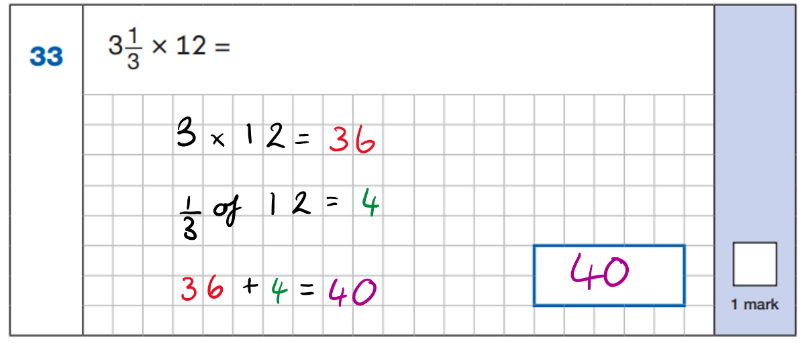
If the children understand that ‘x’ and ‘of’ mean the same thing that 3 1/3 x 12 can become 3 1/3 of 12. No converting required!
The penultimate question in the paper assesses similar concepts to those discussed already. Again, fractions are involved. Again, multiplication is involved. Children were slightly more successful with this question than question 33 with an average of 49%* getting it correct – however, that is just slightly less than half of last year’s Year 6 pupils.
Here are 2 ways children might have solved this:
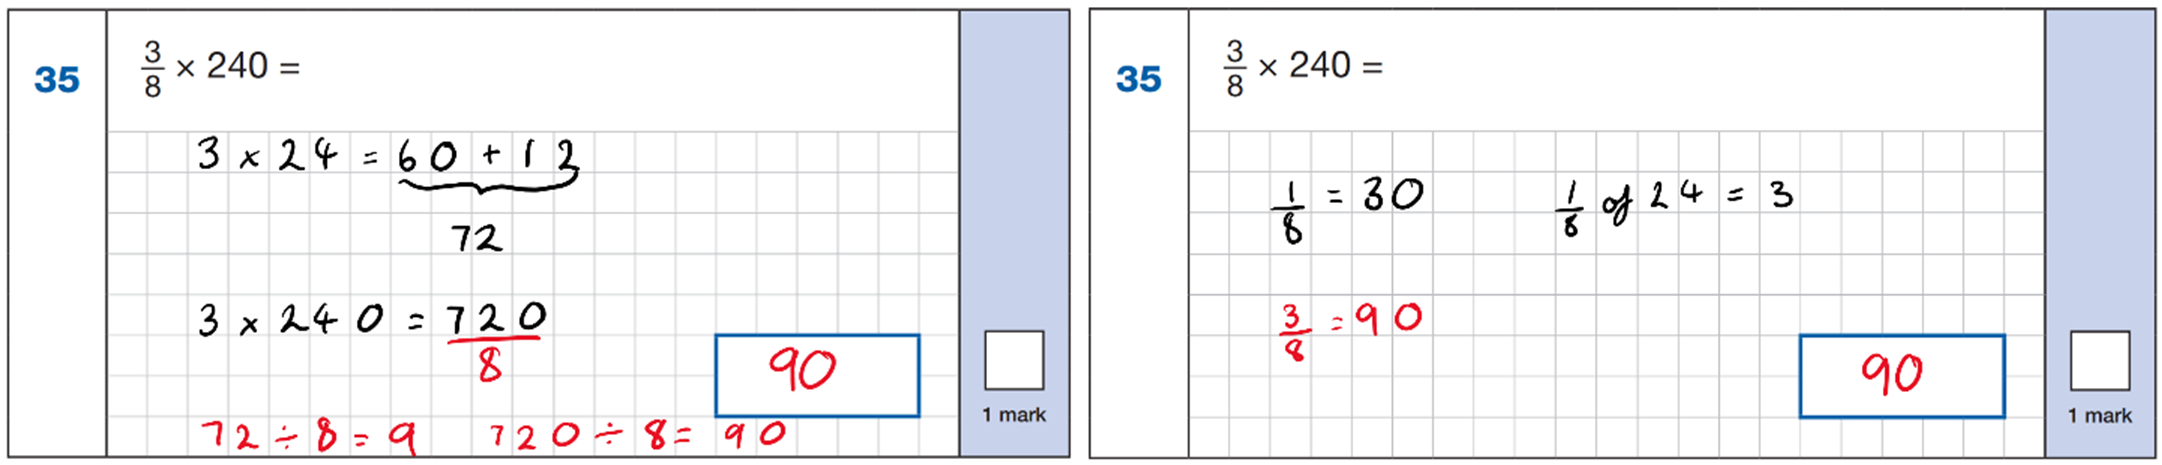
How often in our rehearsal opportunities are children (and adults) discussing different strategies and assessing efficiencies? And following these discussions, are additional examples provided so that different strategies can be ‘tested’ out for their efficiency in different contexts?
Wrapping this together
I hope that it has been useful and interesting, seeing how the QLA can be used to gain insights into children’s strengths and possible misconceptions. This might also serve as a prompt to revisit how we build conceptual understanding and make explicit links to prior learning as well as strategy development and choice.
Some final reflection questions:
- Are we using what we know about the arithmetic paper structure and coverage to design practice for our pupils, when and where appropriate?
- Are we focusing on concepts and understanding, as well as processes and methods?
- Are we narrating the possible strategy choices, highlighting ‘efficient’ ways but referring to context to decide what makes it efficient?
- Are we looking at the current cohort and their needs, whilst using what we have learned from previous groups of pupils?
Resource: Key Stage 2 Arithmetic Paper Question Summary 2018-2025. This support might be useful if planning rehearsal opportunities in lessons, arithmetic quizzes or maths fluency sessions.
*Percentage data rounded to the nearest whole number.
Laura Dell